Whatever might be possible in theory, actually existing capitalism has always relied on the globally uneven cheapening of labor and nature, the sacrifice of far-flung lives and ecosystems at the altar of relentless production, and the constant expulsion of populations alternately surplus and super-exploited...If capital and the state form the totality of the social order, then wresting control of the state—its representative, regulatory, financial, and legal institutions—is a means of contesting capital’s control over investment, production, and distribution. 1

Foreign Direct Investment activities over time

Dessert wines are categorized by their exceptional sweetness. Achieving the desired levels of sweetness depends on the types of grapes, their natural sweetness, if and what type of bacteria is allowed to interact with the grapes, and when certain sugars and alcohols are added during the production process of the wine itself. The production of dessert wine requires a technical knowledge of the distilling process, available land for vineyards, facilities for the production and storage of the wine, and considerable labor to plant, harvest, distill, and bottle the wine. In 1685, Simon van der Stel, the son of an official in the Dutch East India Company was promoted from Commander to Governor of the Cape of Good Hope. The governorship came with a large estate, which van der Stel, eager to reproduce the vineyards he owned in the Netherlands, turned the part of the estate known as Groot Constantina into a winery. 2 Located within the contemporary municipal boundary of Cape Town, South Africa, van der Stel’s Groot Constantina, continued producing wine through the 1880s. The government of the Cape of Good Hope purchased Groot Constantina in 1885 turning it into a cultural site and maintaining its productive capacity, but stopping the production of its most famous wine, Grand Constance, a dessert wine exported all over Europe. In 2003, production of the dessert wine resumed, priced at 78.00 USD for 375 ml (half a bottle), alongside its regular production of respected red wines. 3 Despite no longer owning and operating the vineyard, the Dutch East India Company acted as a proto-Foreign Direct Investment vehicle in South Africa and across much of the world during the 17th and 18th centuries. Export profits from the wine, whose international notoriety is registered in its appearance in Jane Austen’s Sense and Sensibility, were tied to the landed colonial elites, not to South Africa or its people. Put another way, land in South Africa was seized, developed, and then used to produce a commodity that funneled the bulk of its profits to absentee landowners across the British Empire.

A GUINNESS WORLD RECORDS™ title for the Most expensive Port wine sold at auction was set [in 2019] with the sale of the first Niepoort in Lalique 1863 decanter. Filled with the exceptionally rare 155-year-old vintage Port created in 1863 by the first Niepoort generation, Franciscus Marius van der Niepoort and contained within a meticulously crafted Lalique crystal demijohn decanter, it sold for HK$ 992,000 (approx. US$127,000) at Acker Merrall & Condit, Hong Kong. 4

While colonial routes of power focused on moving raw materials from the colonies towards the metropoles, contemporary international development methods are focused on identifying “under-developed” nations and conditioning foreign aid, FDI, and other forms of capital investment on the adoption and diffusion of liberal, market-oriented strategies—nearly all of which reproduce colonial North-South relations. Both private international and intergovernmental loans and investments focus on languages of growth and recovery in developing nations, even as they make claims of ‘greenness’. 

Much of the rhetoric surrounding international development policy and foreign direct investment revolves around markets and globalization—and nearly all of the aid itself is about conditioning financial support from the nations in the Global North on “free market reforms” from leaders in Global South nations. For example, the IMF and World Bank offer a Green Bond program, aimed at securing money from fixed income investors that can then be lent out through the World Bank. The 2020 Impact Report on Green Bonds touts the 14.4 billion in funding provided to date through the program, with 4.6 billion dollars invested in renewable energy, 3.5 billion in clean transportation, and 1.1 billion in agriculture, land use, and forest and ecological resources. 5 Some of these reforestation efforts have gained international acclaim, and enough initial press to cover the effects these projects are having on regional water supplies. These green projects provide a publicly sustainable face for the IMF and World Bank, while they quietly encourage ‘low income’ nations to develop their liquid natural gas (LNG) and coal resources or privatize their coal energy infrastructure to combat their precarious debt levels. A 2021 report, IMF Surveillance and Climate Change Transition Risks, found that the IMF, between 2015 and 2020 was developing Article IV reports, long term economic planning advice, that encouraged Mozambique, by overestimating the potential revenue windfall, to first develop coal burning power plants, and following the crash of that market, to invest heavily in liquid natural gas infrastructure. 6 Mozambique is considered in debt distress, the highest level of debt unsustainability ranked by the IMF, with a debt of 9.7 billion. Mozambique is essentially dependent on LNG to climb out of the debt they accrued in developing gas and coal infrastructure in the first place. During the same time, the report also found the IMF promoted privatization of Indonesian coal-power plants, a move that through a legal settlement has secured the existence of 12 coal power plants valued at 7.9 billion dollars. 7 In a NYT’s article, Somini Sengupta reveals how saddling developing countries with debt is actually limiting state-led efforts to maintain new markets. 8 As climate disasters continue to occur with increasing frequency, and unevenly impact nations World Bank identifies as ‘low-income’, these countries, like Belize, are subject to a debt cycle wherein the effects of the Climate Crisis weaken their economic stability, requiring them to take on increasing amounts of debt in order to fund climate action and disaster recovery efforts. Sengputa notes how the debt Belize has taken on has hurt its international credit rating, “making it tougher to get loans on the private market.” 9 Practices like these leave nations dependent on loans from the IMF or World Bank, or lead them to develop policies attractive to foreign investors hoping to to bolster economic growth.  

  • Map of the globe showing loans from the IMF to member countries as of 2019
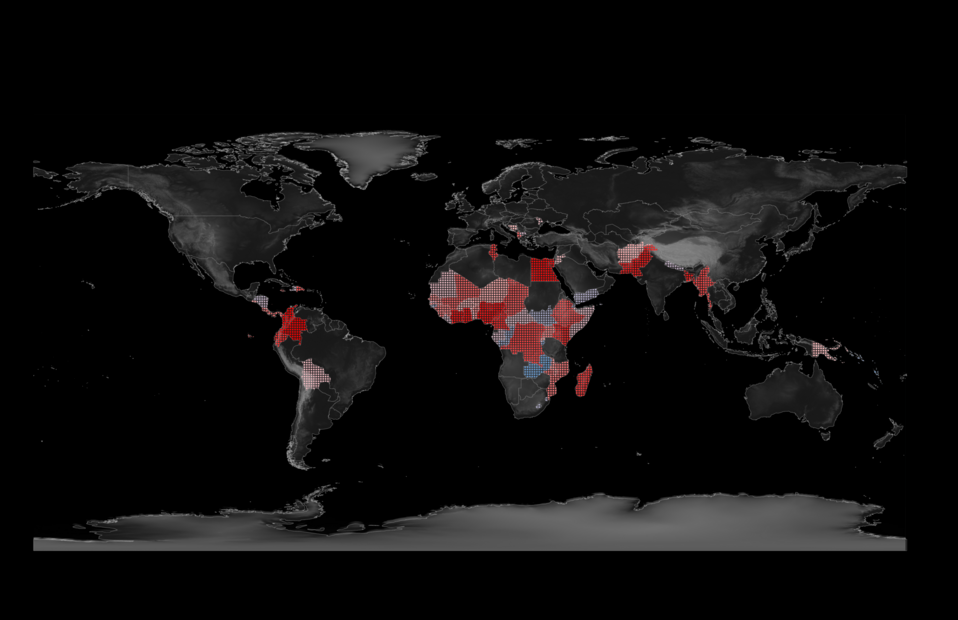
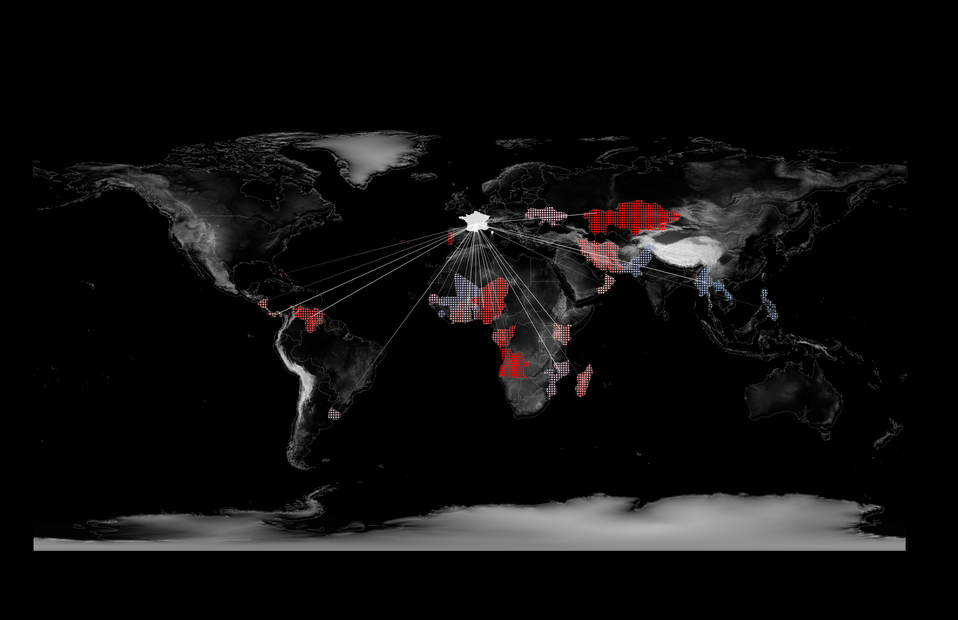
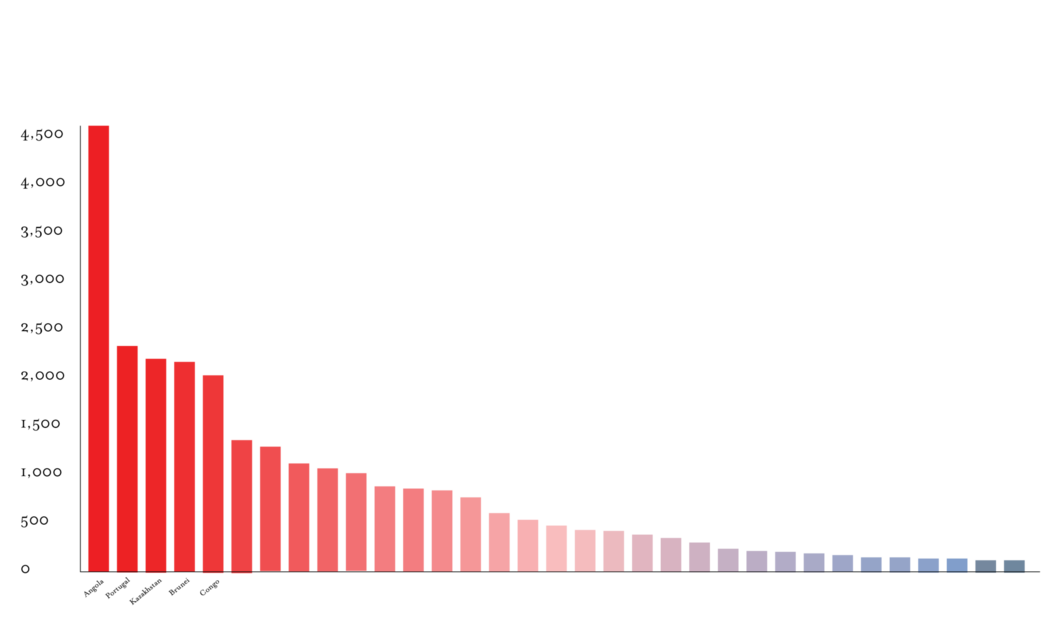
    Map of the globe showing loans from the IMF to member countries as of 2019
  • Map of the globe showing loans from the World Bank to member countries as of 2019
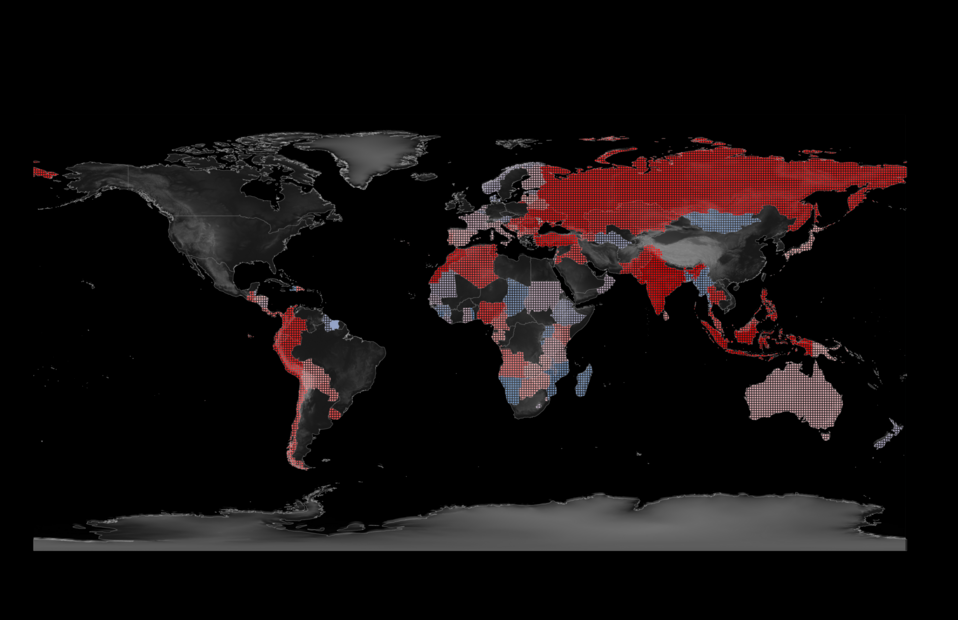
    Map of the globe showing loans from the World Bank to member countries as of 2019

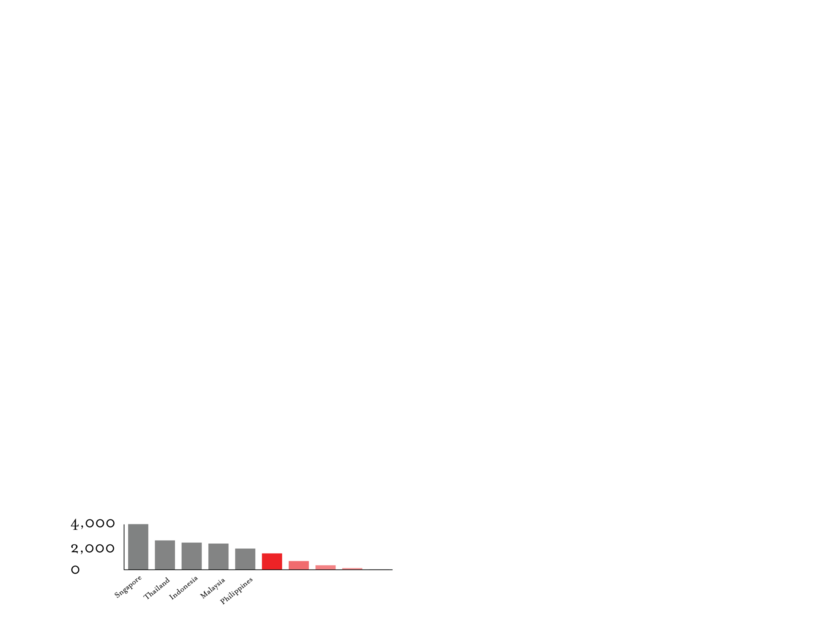
These maps represent the loans from the World Bank and the IMF to its member countries as of 2019. The amount mapped is the summation of all the different types of loans and grants provided by these institutions. The red to blue gradation represents the highest to lowest investments in terms of monetary value in US dollars. Unlike FDI, these maps are indicative of loans that will need to be repaid even as the Climate Crisis exacerbates droughts, flooding, agricultural viability, population shifts among other factors that will likely result in low-income countries needing to take on further loans. Often cloaked in the language of green-marketing, these loans and development programs seek to open new resource markets for the global economy that often perpetuate the harmful extractive logic that has produced the Climate Crisis. 10

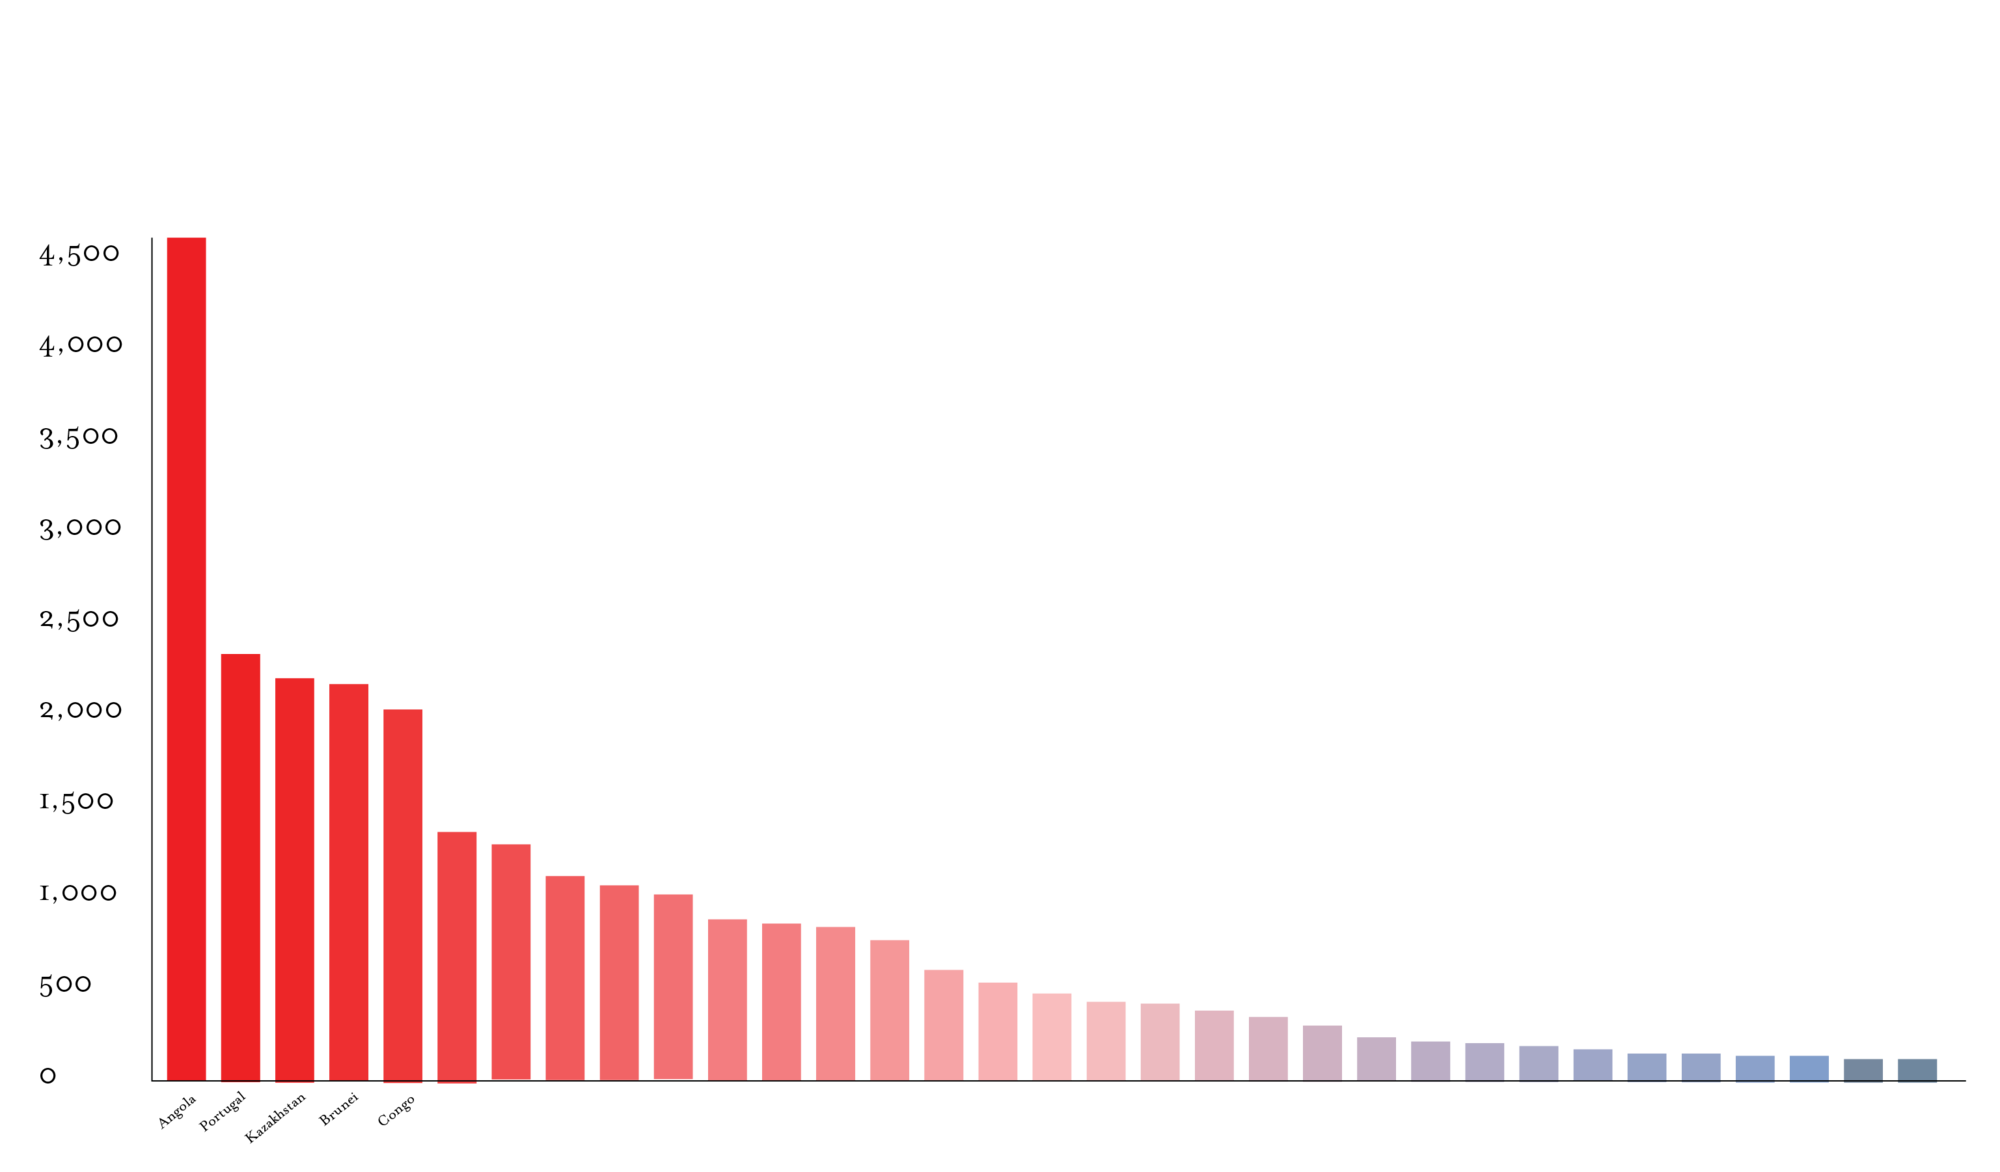
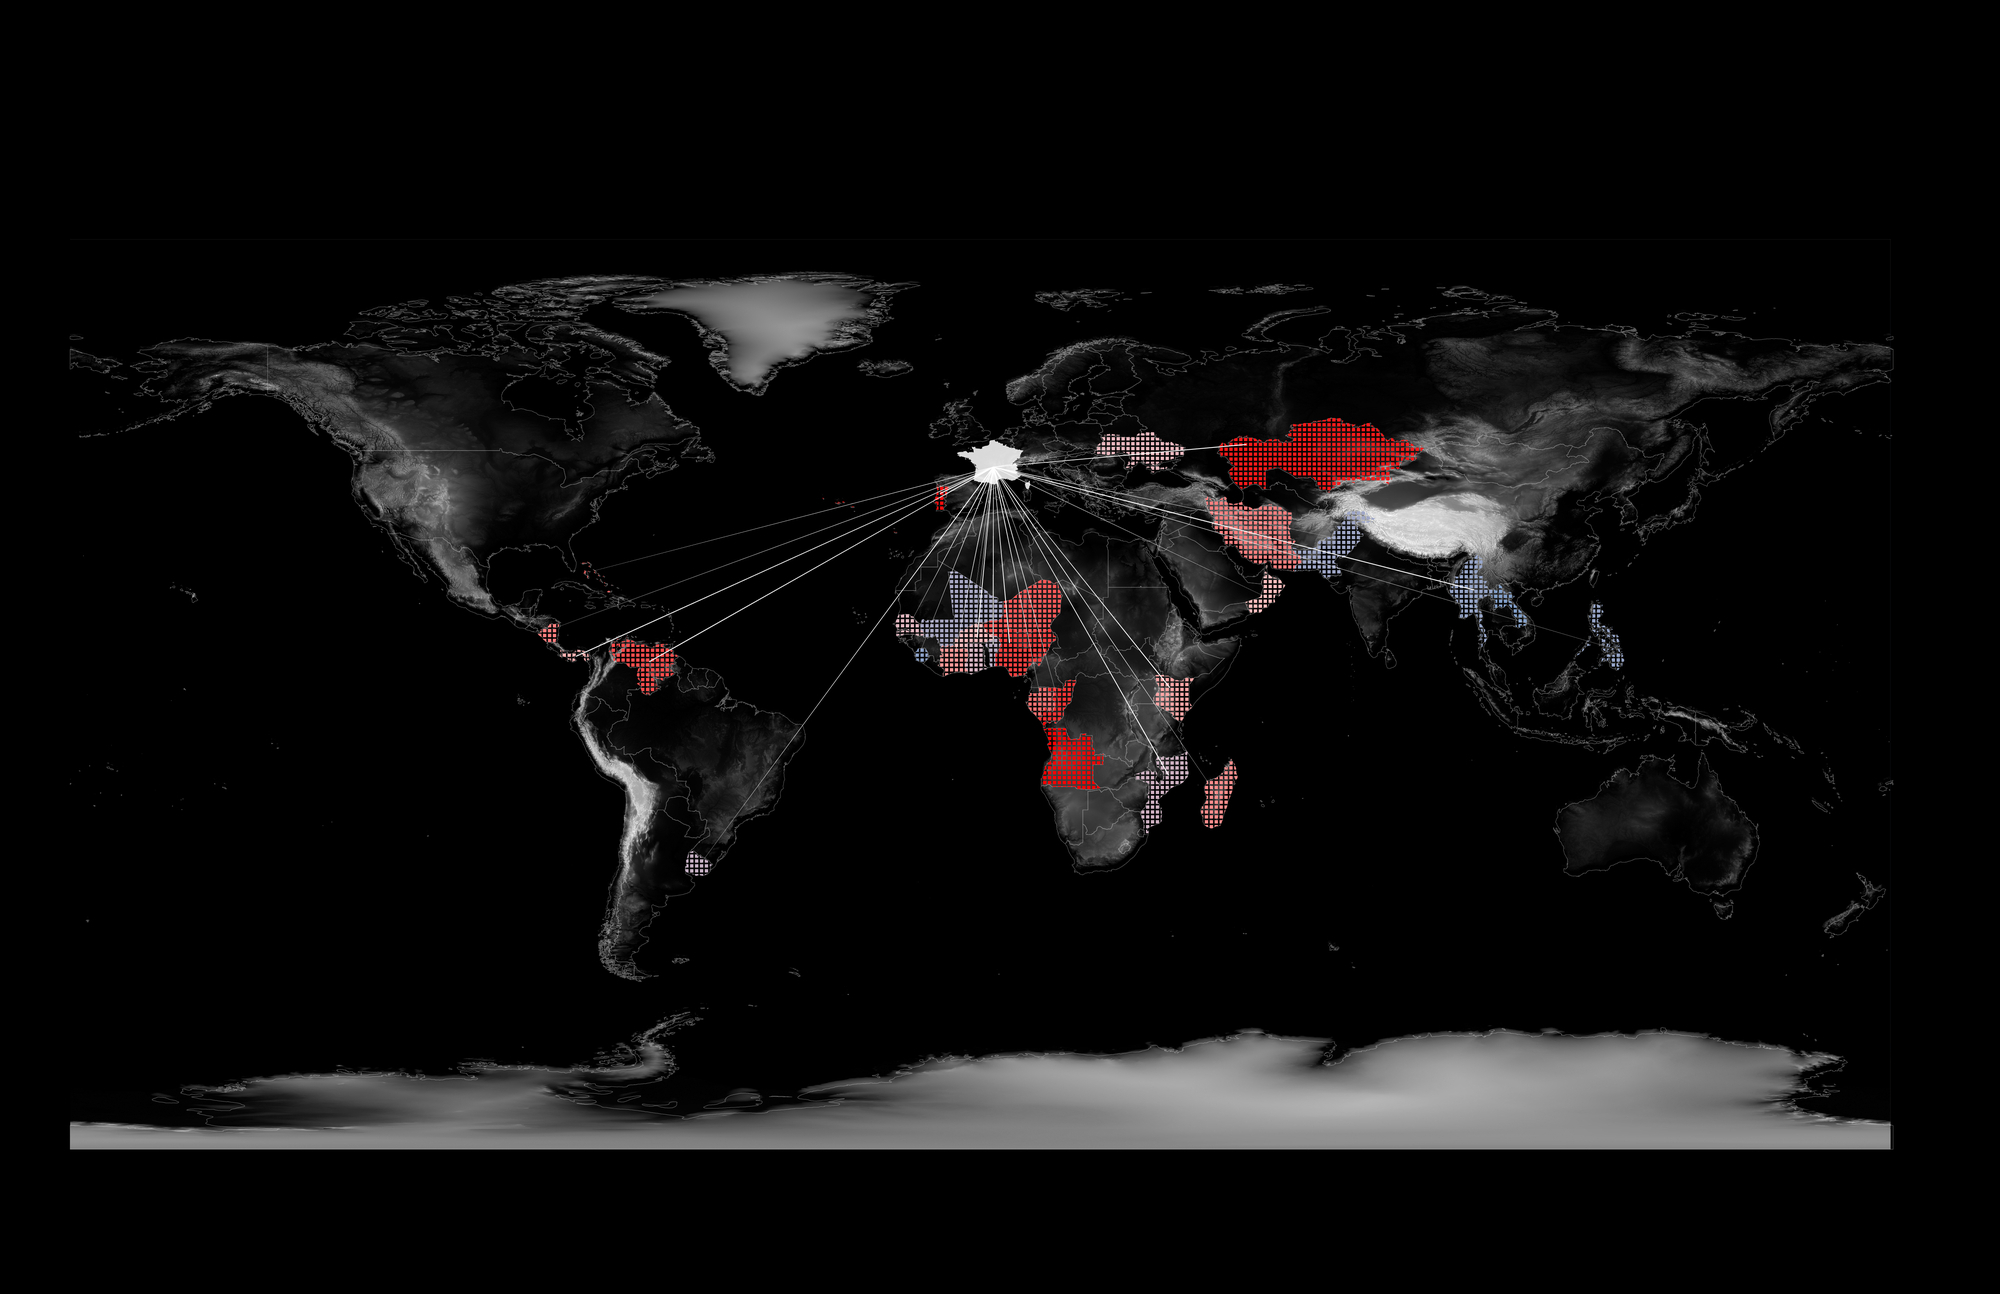
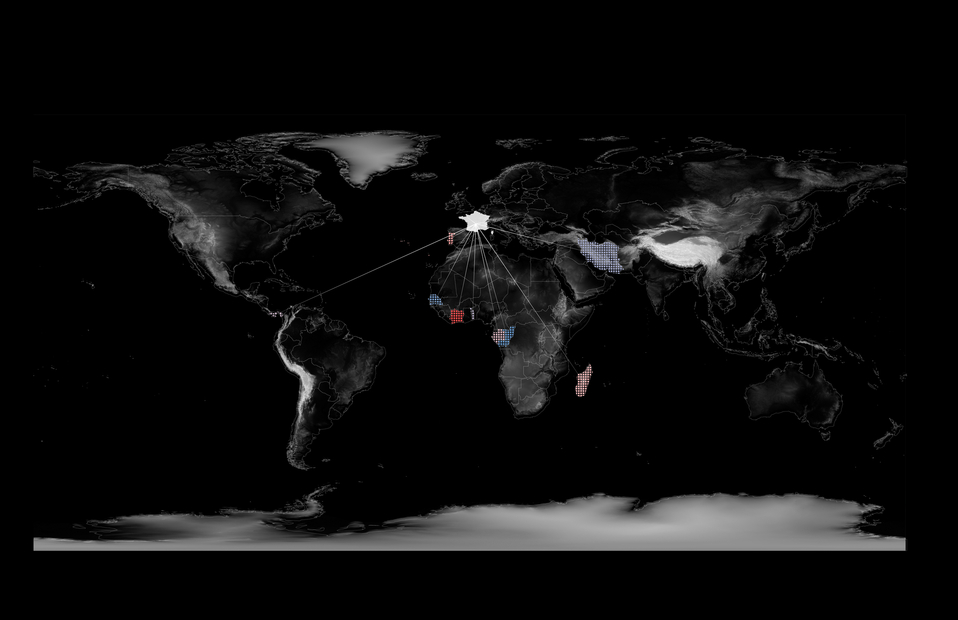
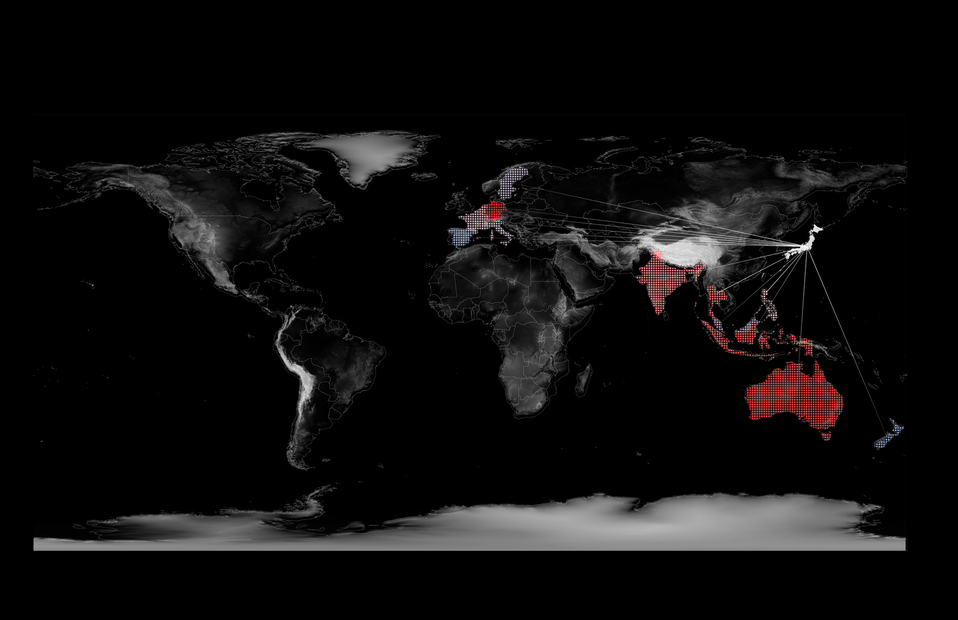
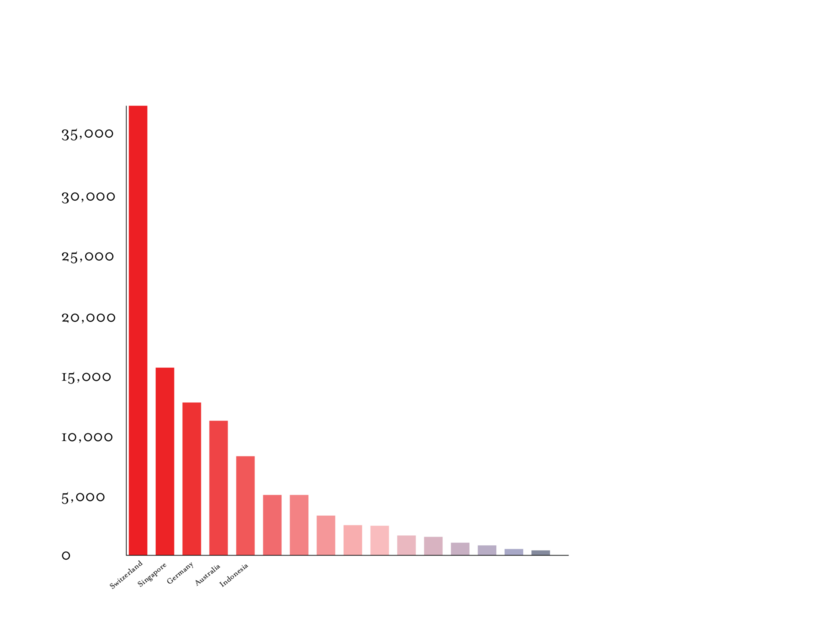
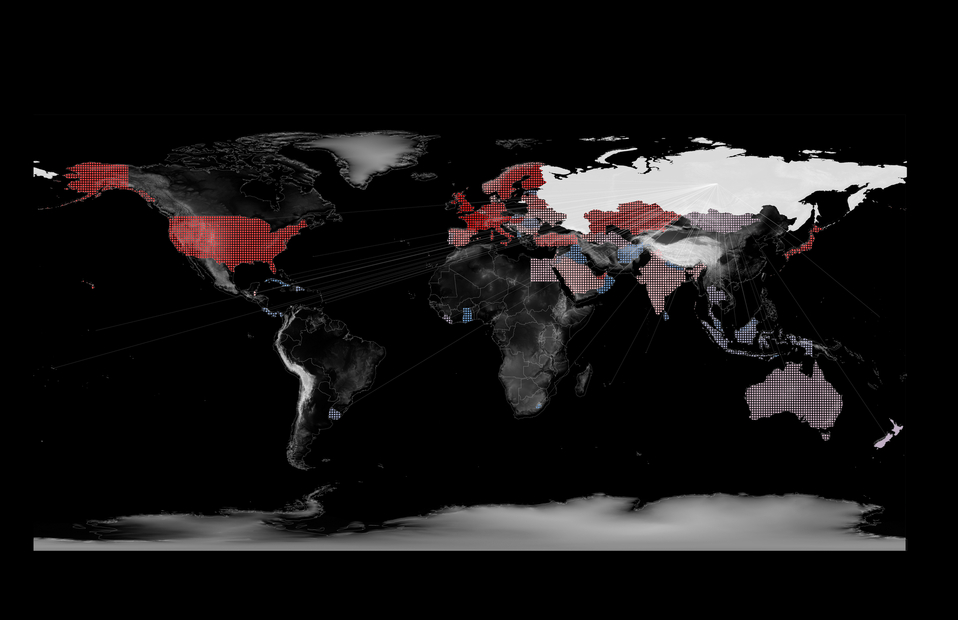
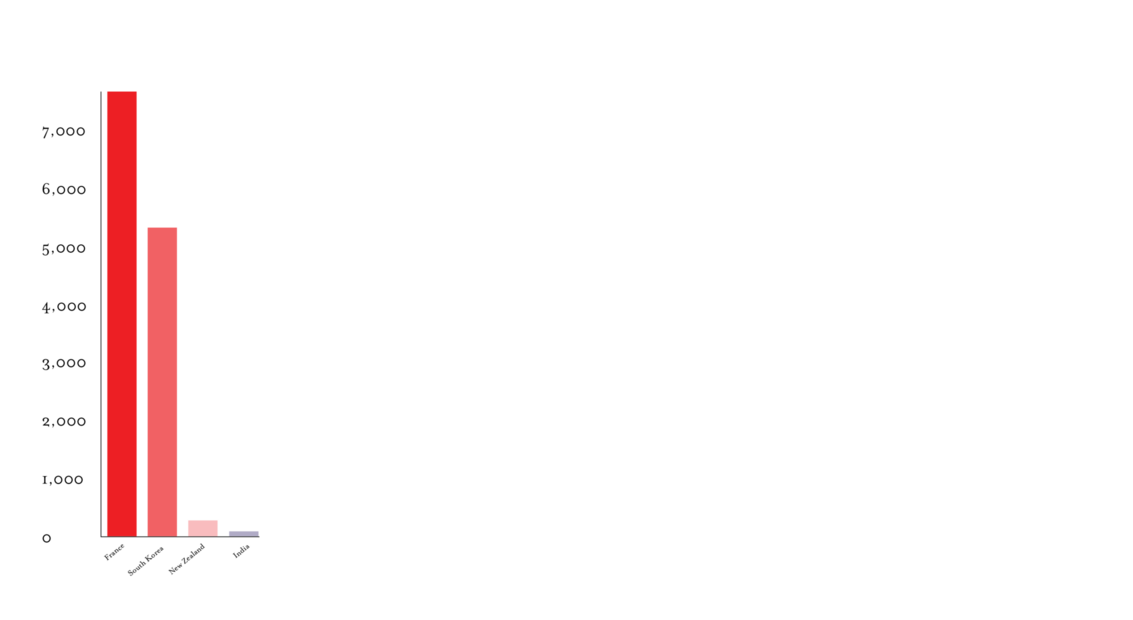
Foreign Direct Investment (FDI) is a specific category of international capital flow in which a corporate entity from one country invests in a foreign corporate entity in another country with the intention of management. Determination of managing intention is predicated on at least a 10% stake in the foreign entity. FDI often takes the form of facility improvement, intra-company loans (loans that flow between financial entities under the same corporate umbrella), and mergers of existing corporate entities. The relationship between the investment, profits, and the loans between the companies is reported as the value of an FDI at the end of each fiscal year, which is then aggregated alongside all of the other investments and reported as a total sum for each country. FDI, as it is reported, is only a numeric value reflective of foreign investment that has occurred. Despite consistent cries from Western publications lamenting the scale of Chinese investment in Africa (see here, here, or here) the largest portion of Foreign Direct Investment into African nations comes from France, a vestige of colonial imposition that is still extracting value from now lost territories. Villainization of non-western investment across the world is likely to increase following the 2021 G7 summit as Western world leaders banded together to launch the Build Back Better World Partnership

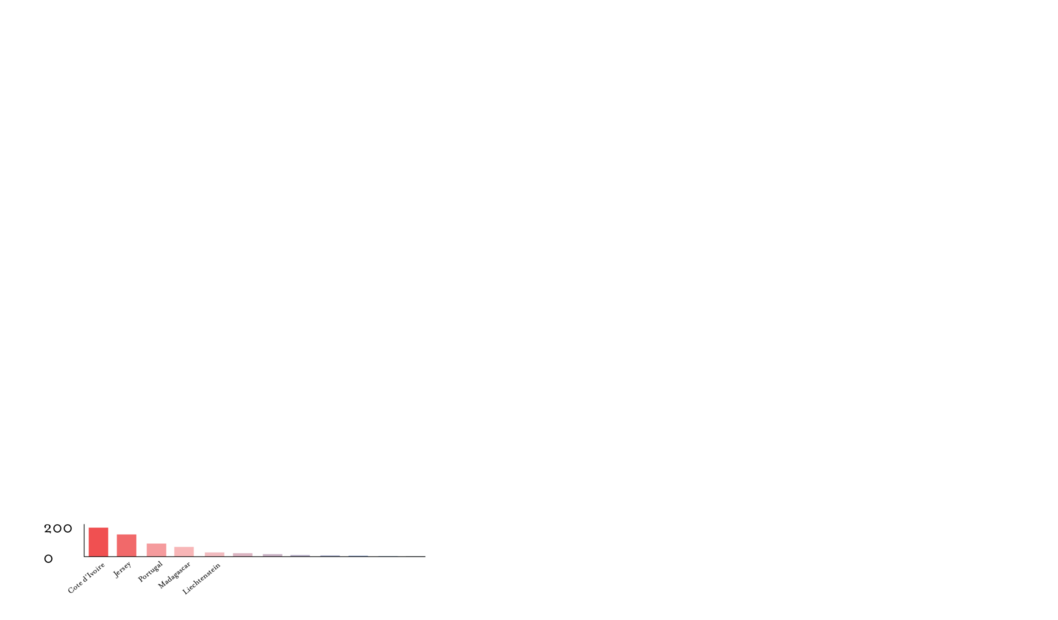
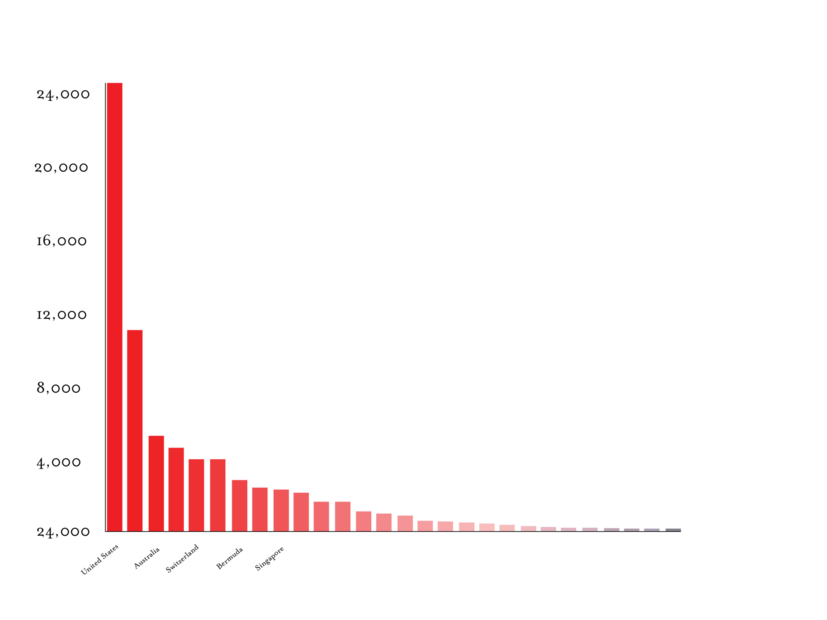
Chart showing the relative scale and disparity of investments out of France and into other countries
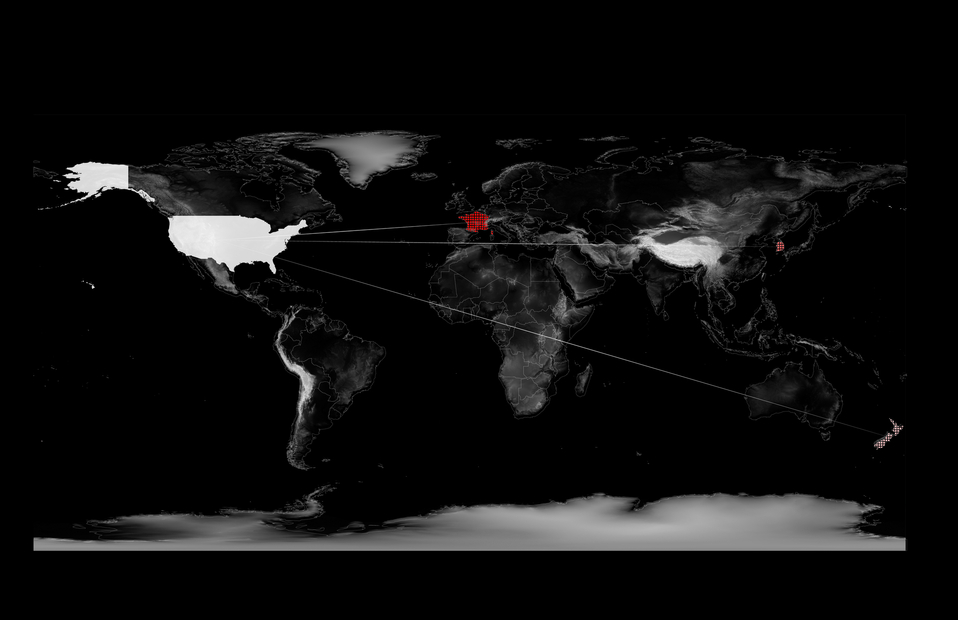
Map of the globe showing the Foreign Direct Investment outflow (money moving from a country out to other countries) from France

In 1980, FDI (adjusted for inflation) amounted to 84.34 billion dollars worth of investment. In 2019, that number was 1.9 trillion dollars. 11 The sheer scale of dollars invested here have sparked much speculation into what factors contribute to and predict the volume of FDI a given country might receive. A review of the literature surrounding potential factors for FDI, found, perhaps unsurprisingly, that the only reliable indicators were market size and instability in a country. These indicators are positive and negative indicators, respectively. A dependence on market size essentially guarantees that the wealthiest counties are going to have nominally higher levels of capital inflow, even as they have the capital wealth to invest in other places. 

The outward flow of capital is dependent on foreign nations having investment policies and structures that lend themselves to lucrative investment, resulting in the formation of many NGOs seeking to promote domestic policy that will attract FDI from wealthy transnational investors. The Organisation for Economic Co-operation and Development (OECD) is an international organization whose aim is to “build policies for better lives [sic].” 12 OECD, among other trading blocs, advocate for constructing domestic policy that both invites FDI to take place and, as they say, better the lives of local citizens. The capability of FDI-led approaches to materially better the lives of poor citizens in developing countries remains unclear in the literature surrounding FDIs. Andrew Sumner, argues that “the case for liberalisation of FDI is questionable” even as “liberalisation, conceptually at least, removes many of the policy instruments that might assist extraction of economic benefits to the local economy.” 13 And while Sumner’s analysis stops short of making a definitive claim on FDI’s ability to materially help the poor, the analysis points to the role of domestic policy in setting the terms of FDIs beyond the initial investment. Furthermore, the extent to which FDI exacerbates natural resource extraction and depletion within developing countries is still not completely mapped, leading to questions about the efficacy of Green FDIs OECD promotes as a mutually beneficial aid in the fight against the Climate Crisis. 14 Curiously, the OECD positions the responsibility of increased CO2 emissions at the feet of developing nations and not already developed nations who have historically produced the majority of CO2 emissions. 

  • 11At the time of writing, the 2020 FDI figures had been released, and stood at 849 billion dollars of investment, a 42% drop in investment from 2019. The 2019 numbers are cited as they better reflect the trend of increased FDI and are outside the economic stand-still caused by the COVID-19 Pandemic.
  • 12Development in Practice , Jun., 2005, Vol. 15, No. 3/4 (Jun., 2005), pp. 269-285 Published by: Taylor & Francis, Ltd. on behalf of Oxfam GB.
  • 13Golub, S. S., C. Kauffmann and P. Yeres (2011), “Defining and Measuring Green FDI: An Exploratory Review of Existing Work and Evidence”, OECD Working Papers on International Investment, 2011/02, OECD
  • 14Development in Practice , Jun., 2005, Vol. 15, No. 3/4 (Jun., 2005), pp. 269-285 Published by: Taylor & Francis, Ltd. on behalf of Oxfam GB.
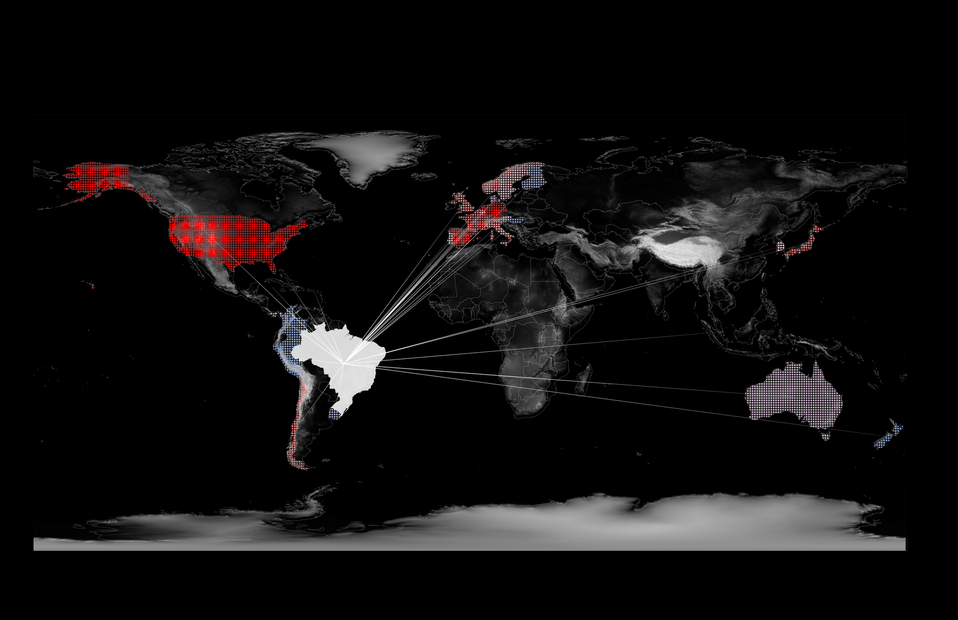
  • Map of the globe showing the FDI inflow into Brazil in 2019-2020
    Map of the globe showing the FDI inflow into Brazil in 2019-2020
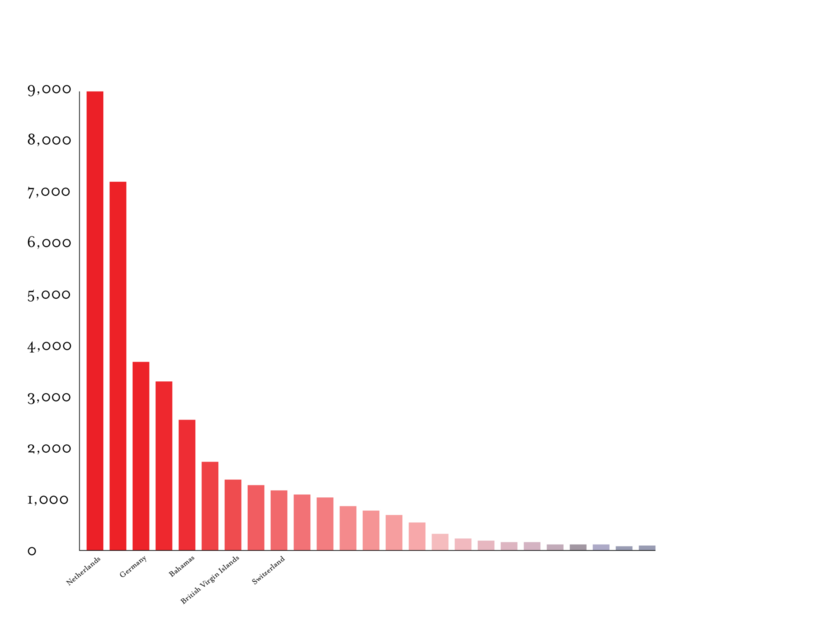
  • Chart showing the FDI inflow into Brazil in 2019-2020
    Chart showing the FDI inflow into Brazil in 2019-2020
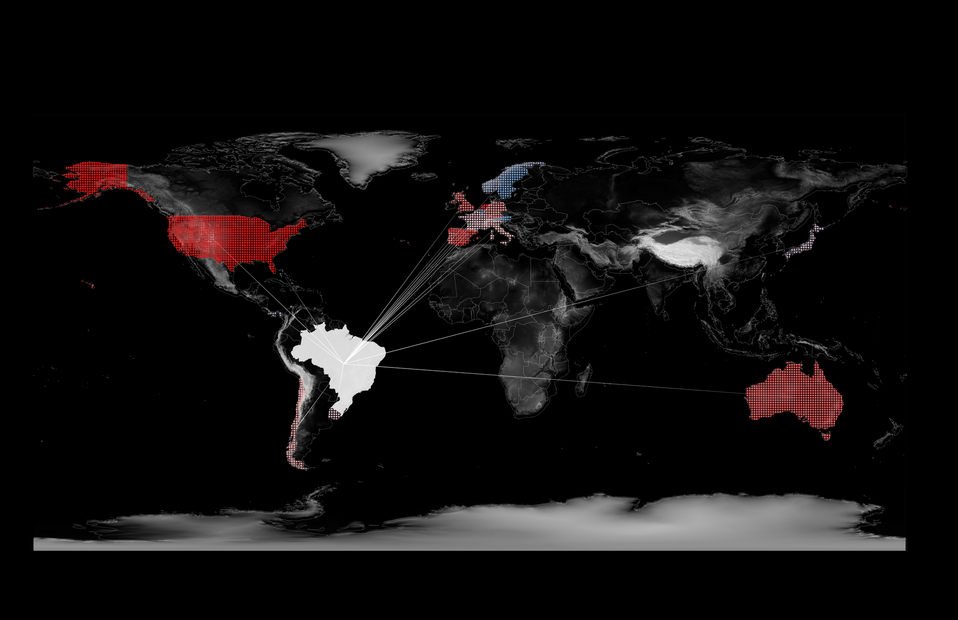
  • Map of the globe showing the FDI outflow from Brazil in 2019-2020
    Map of the globe showing the FDI outflow from Brazil in 2019-2020
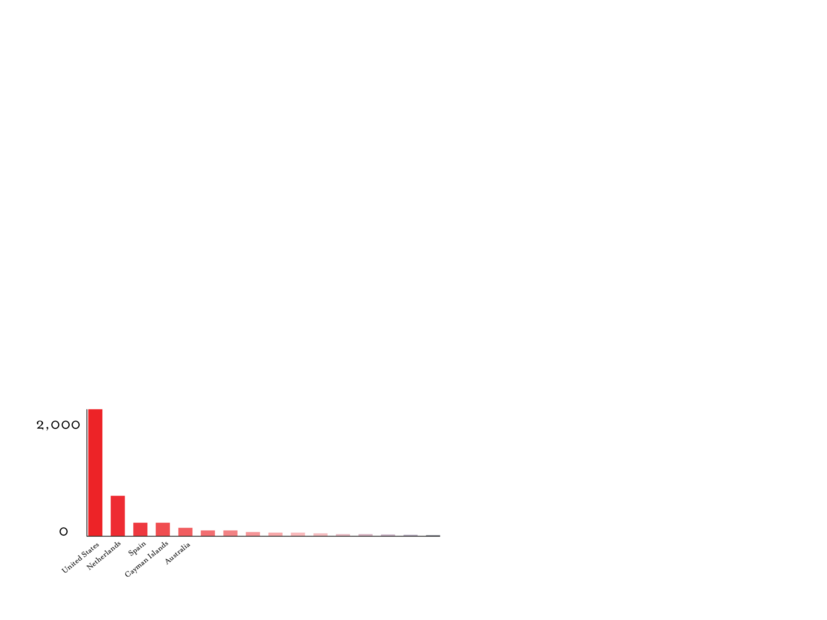
  • Chart showing the FDI outflow from Brazil in 2019-2020
    Chart showing the FDI outflow from Brazil in 2019-2020
  • Map of the globe showing the FDI inflow into France in 2019-2020
    Map of the globe showing the FDI inflow into France in 2019-2020
  • Chart showing the FDI inflow into France in 2019-2020
    Chart showing the FDI inflow into France in 2019-2020
  • Map of the globe showing the FDI outflow from France in 2019-2020
    Map of the globe showing the FDI outflow from France in 2019-2020  
  • Chart showing the FDI outflow from France in 2019-2020
    Chart showing the FDI outflow from France in 2019-2020
  • Map of the globe showing the FDI inflow into India in 2019-2020
    Map of the globe showing the FDI inflow into India in 2019-2020  
  • Chart showing the FDI inflow into India in 2019-2020
    Chart showing the FDI inflow into India in 2019-2020  
  • Map of the globe showing the FDI outflow from India in 2019-2020
    Map of the globe showing the FDI outflow from India in 2019-2020  
  • Map of the globe showing the FDI inflow into Japan in 2019-2020
    Map of the globe showing the FDI inflow into Japan in 2019-2020
  • Chart showing the FDI inflow into Japan in 2019-2020
    Chart showing the FDI inflow into Japan in 2019-2020
  • Map of the globe showing the FDI outflow from Japan in 2019-2020
    Map of the globe showing the FDI outflow from Japan in 2019-2020  
  • Chart showing the FDI outflow from Japan in 2019-2020
    Chart showing the FDI outflow from Japan in 2019-2020  
  • Map of the globe showing the FDI inflow into Russia in 2019-2020
    Map of the globe showing the FDI inflow into Russia in 2019-2020  
  • Chart showing the FDI inflow into Russia in 2019-2020
    Chart showing the FDI inflow into Russia in 2019-2020
  • Map of the globe showing the FDI outflow from Russia in 2019-2020
    Map of the globe showing the FDI outflow from Russia in 2019-2020  
  • Chart showing the FDI outflow from Russia in 2019-2020
    Chart showing the FDI outflow from Russia in 2019-2020  
  • Map of the globe showing the FDI inflow into Sweden in 2019-2020
    Map of the globe showing the FDI inflow into Sweden in 2019-2020  
  • Chart showing the FDI inflow into Sweden in 2019-2020
    Chart showing the FDI inflow into Sweden in 2019-2020  
  • Map of the globe showing the FDI outflow from Sweden in 2019-2020
    Map of the globe showing the FDI outflow from Sweden in 2019-2020  
  • Chart showing the FDI outflow from Sweden in 2019-2020
    Chart showing the FDI outflow from Sweden in 2019-2020  
  • Map of the globe showing the FDI inflow into the UK in 2019-2020
    Map of the globe showing the FDI inflow into the UK in 2019-2020  
  • Chart showing the FDI inflow into the UK in 2019-2020
    Chart showing the FDI inflow into the UK in 2019-2020  
  • Map of the globe showing the FDI outflow from the UK in 2019-2020
    Map of the globe showing the FDI outflow from the UK in 2019-2020  
  • Map of the globe showing the FDI inflow into the United States in 2019-2020
    Map of the globe showing the FDI inflow into the United States in 2019-2020  
  • Chart showing the FDI inflow into the United States in 2019-2020
    Chart showing the FDI inflow into the United States in 2019-2020
  • Map of the globe showing the FDI outflow from the United States in 2019-2020
    Map of the globe showing the FDI outflow from the United States in 2019-2020  
  • Chart showing the FDI outflow from the United States in 2019-2020
    Chart showing the FDI outflow from the United States in 2019-2020
  • Chart showing the World Bank FDI in 2019-2020
    Chart showing the World Bank FDI in 2019-2020

Foreign Direct Investment is a measure of capital flow, with the specific intent of obtaining a managing interest (>10% stake), between corporate or public entities in different countries. While touted as an impartial piece of data, developing countries actively enact policies to attract foreign investment, increasingly in the name of sustainable development, while outsourcing their natural resources, and the wealth associated with them, to foreign corporations. FDI is nota measure of material wealth that is passed on to local citizens in the country or region of investment.

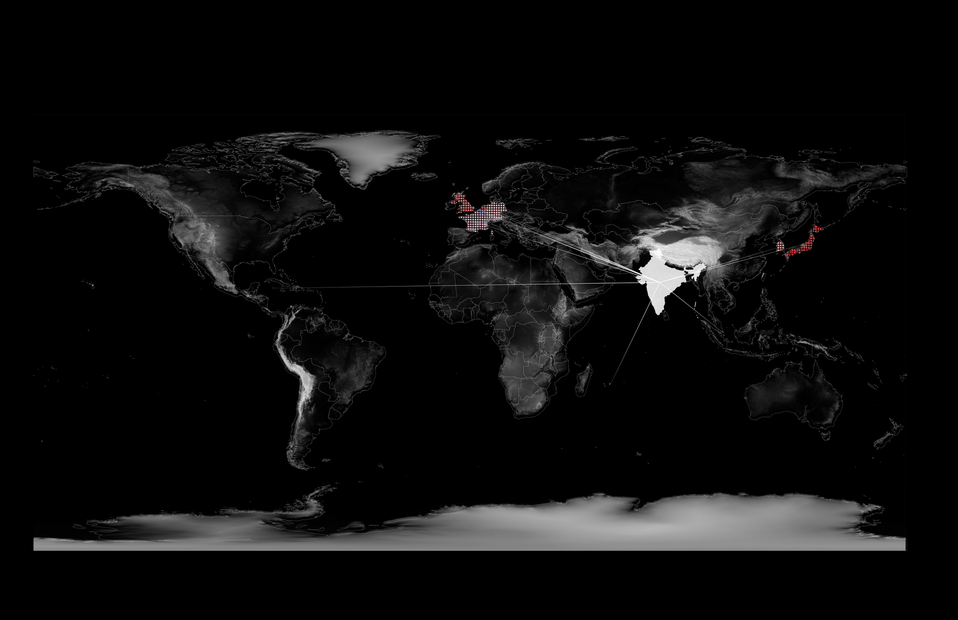
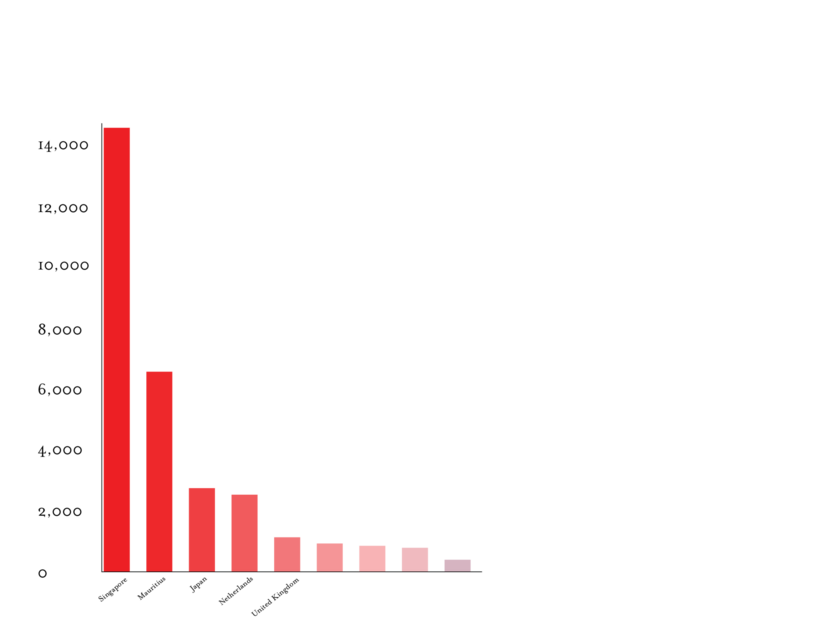
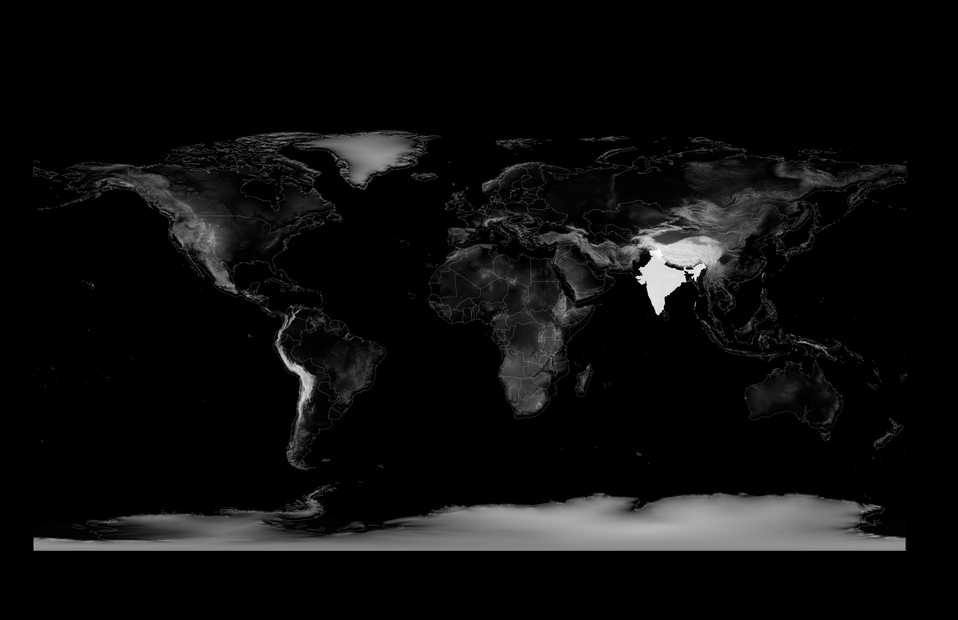
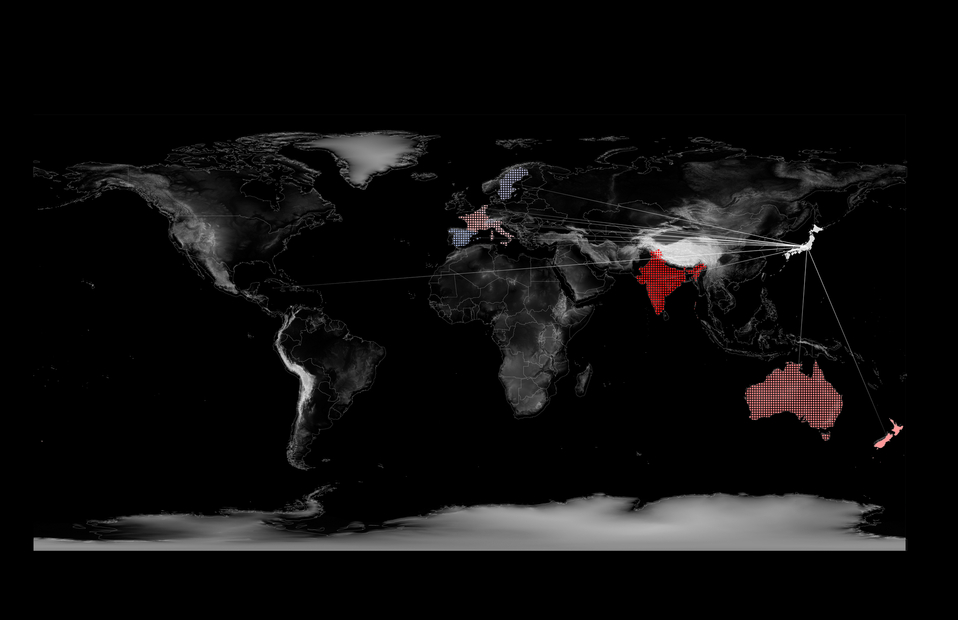
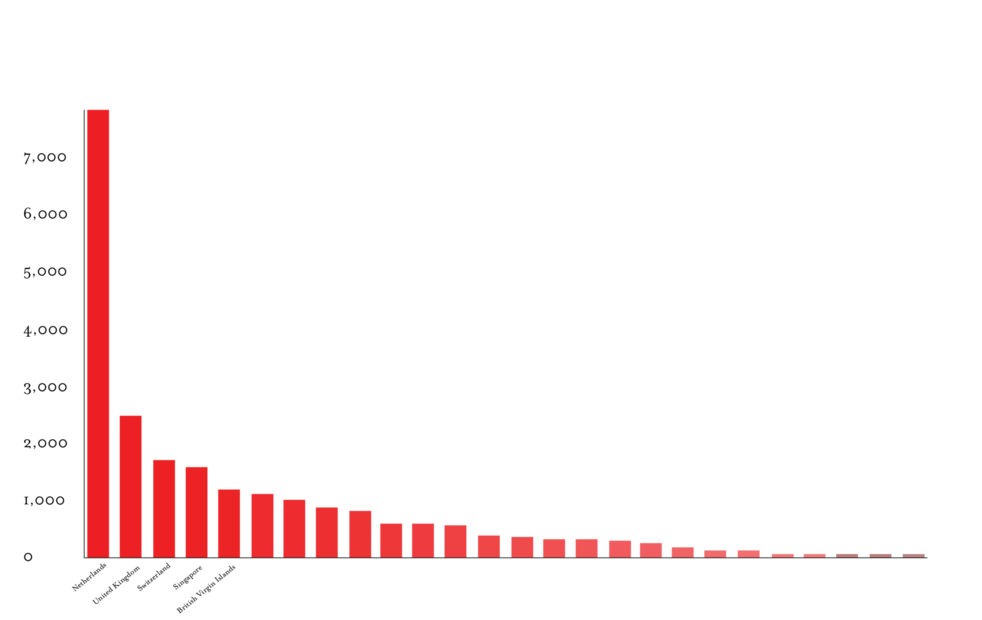
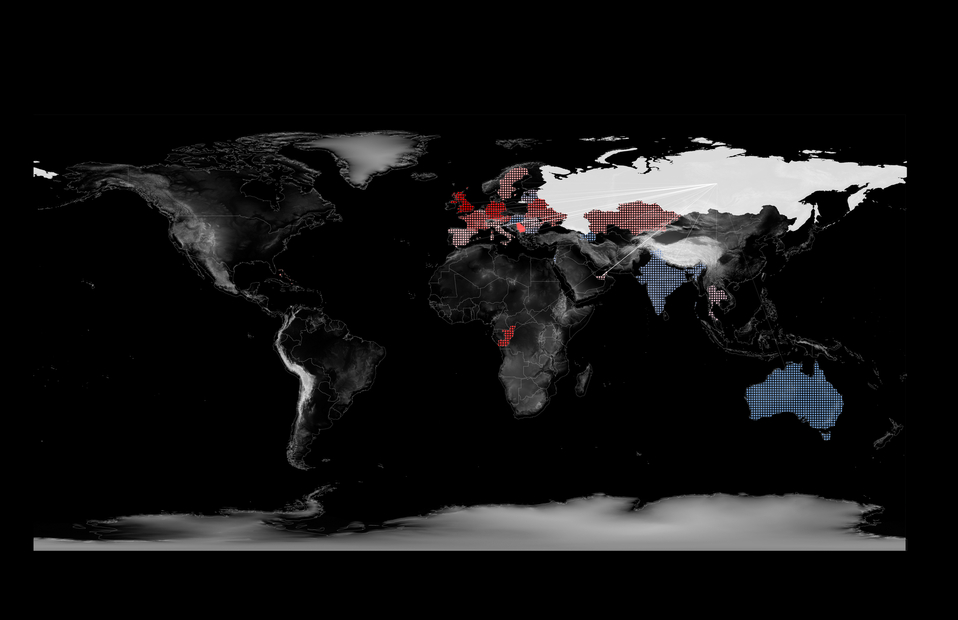
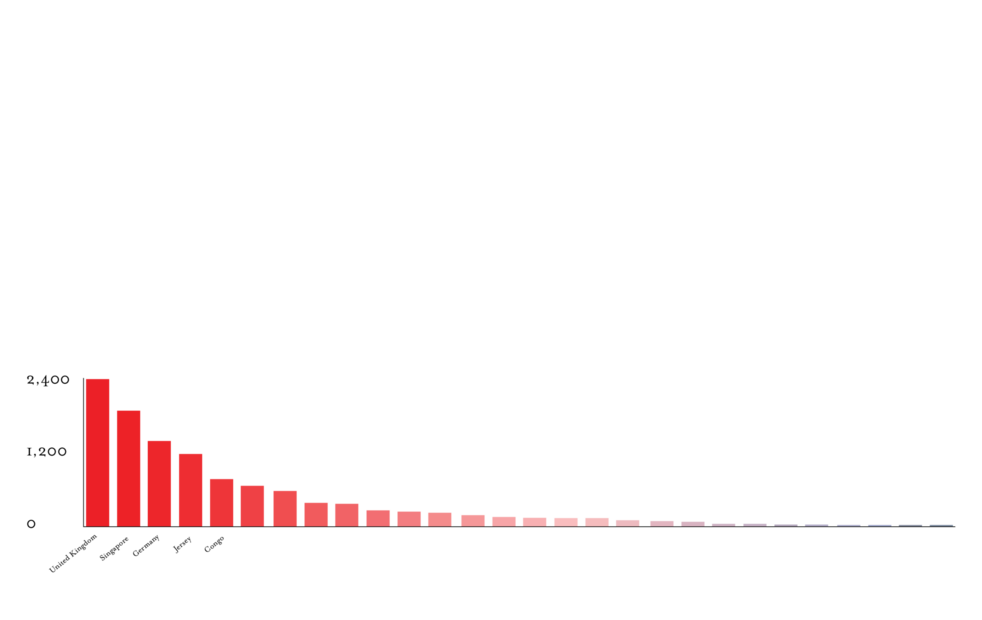
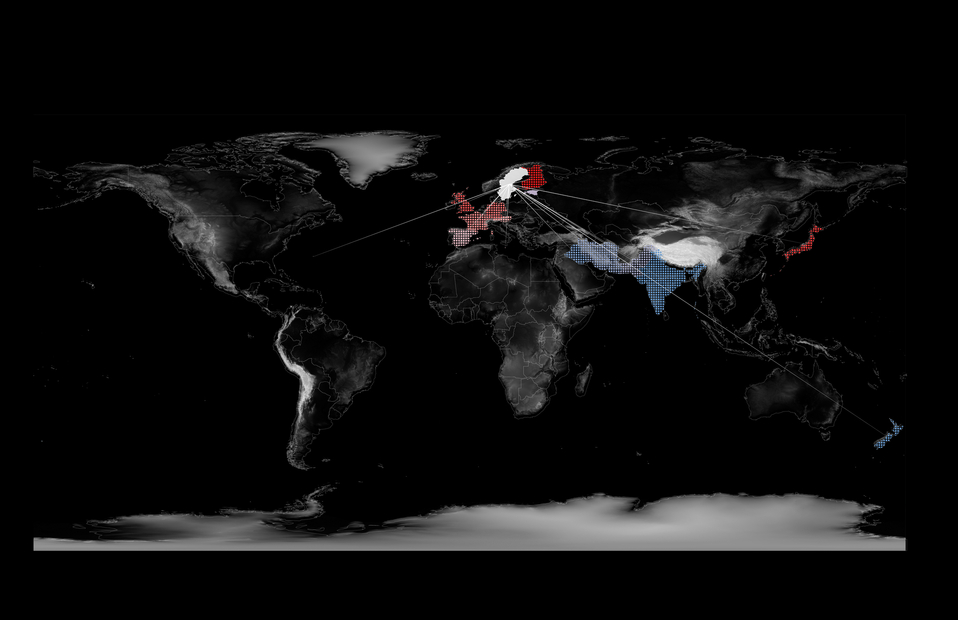
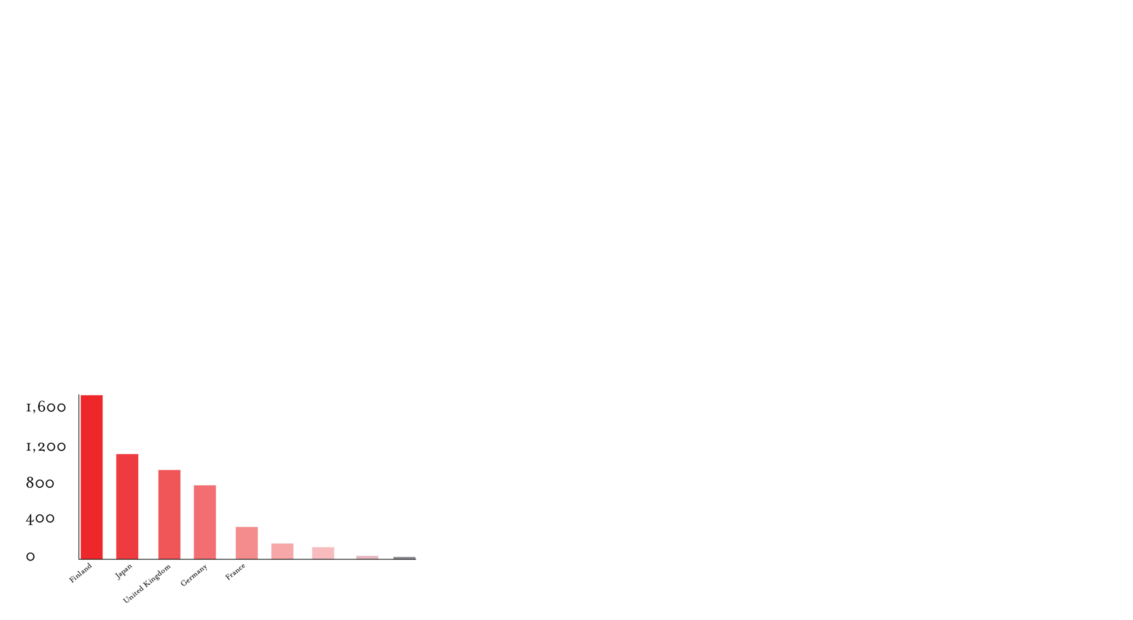
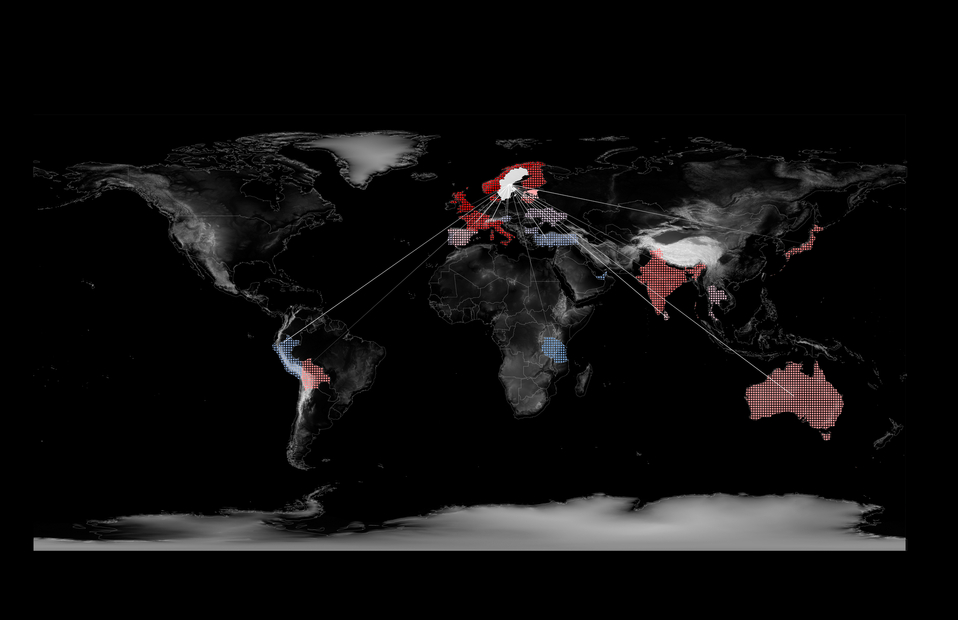
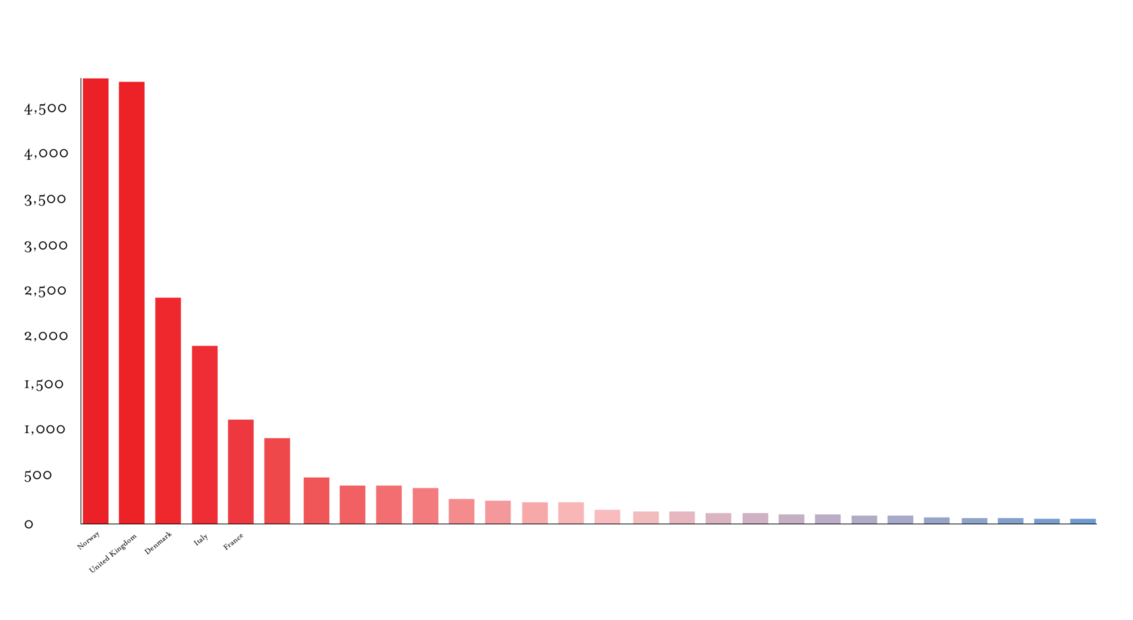
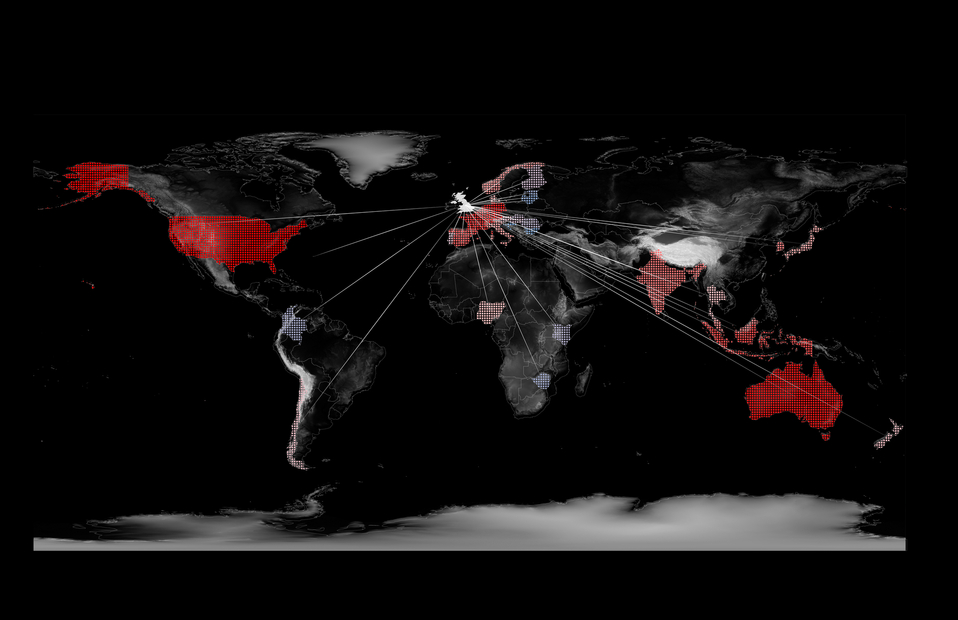
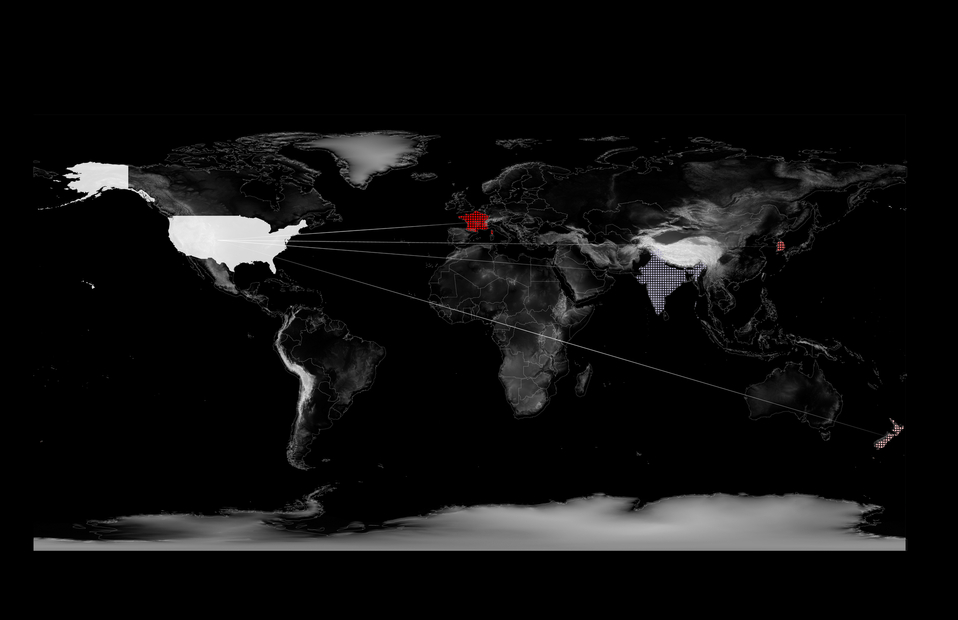
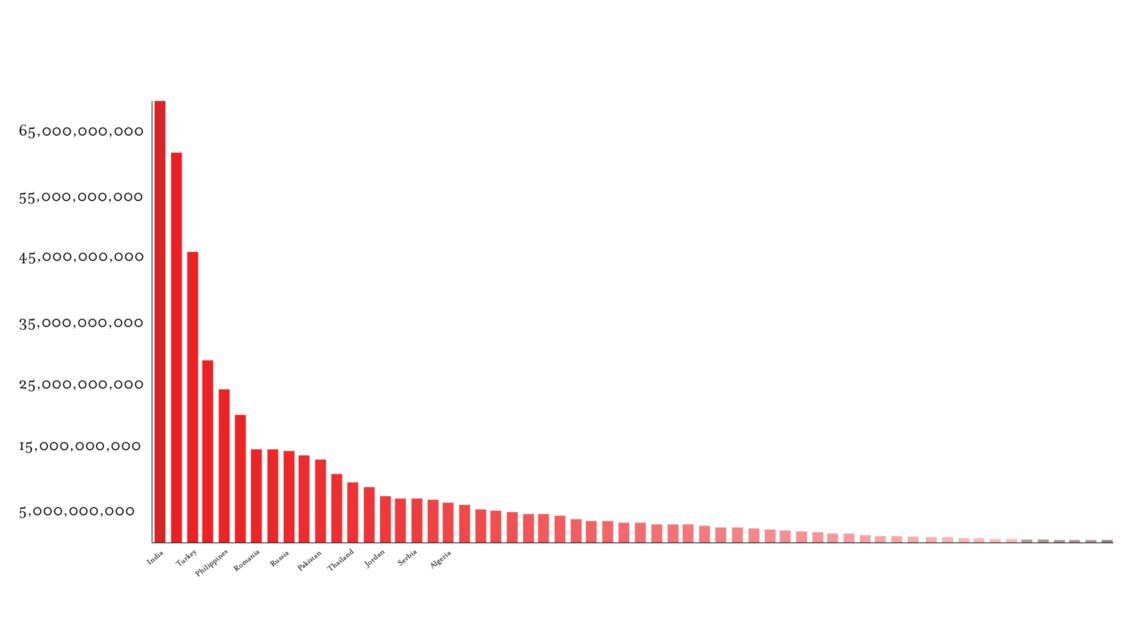
The above set of maps highlights the inflow, money being invested in a country by foreign investors, and outflow, money moving from a country out to other countries, for the with the 10 highest cumulative FDI in US dollars for OECD member nations in 2019-2020: Brazil, China, France, Germany, India, Russia, Sweden, US and the UK. China, Germany, and Mexico are notable exceptions from the graphics, as they do not have publicly available FDI data. As such, these countries are included in the set of top 10, but the network of countries receiving and providing investment dollars is not shown. Each highlighted country is shown in white, with a gradient from red (highest) to blue (lowest) for the top ten countries either receiving or providing investment dollars. Each map contains a bar graph to display the relative scale and disparity of investments to and from each country in the network. 15

Ultimately, the statistical representation of FDI makes it a difficult concept to evaluate. In some ways it is simply a measure of private capital flow internationally, which can point to different patterns in capital investment between the global North and South. On the other hand, it is the object of desire for some domestic policies in developing countries, rendering it a speculative device for future sustained growth. As Sumner highlights, attention should be paid to individual policies adopted by developing nations and their ability to attract investment schemes that better local lives in materially sustained ways. 16

Today, the particularities of Foreign Direct Investment are shrouded in its statistical aggregation. Data is reported on a country-wide scale, with breakdowns of inflow and outflow from each country. This aggregate reporting lumps together all corporations, regardless of their ability to stimulate local economic growth, provide materially better lives, or privatize industries and infrastructure in developing countries. All that is to say, FDI is a number; a number whose distribution patterns (spatially and temporally) reveal more about global market opportunities and national tax structures than about the efficacy and ethics of a particular investment. 17

  • 16Long, Michael, Stretesky, Paul and Lynch, Michael (2017) Foreign Direct Investment, Ecological Withdrawals, and Natural-Resource-Dependent Economies. Society & Natural Resources, 30 (10). pp. 1261-1276. ISSN 0894-1920
  • 17Development in Practice , Jun., 2005, Vol. 15, No. 3/4 (Jun., 2005), pp. 269-285 Published by: Taylor & Francis, Ltd. on behalf of Oxfam GB

Foreign Direct Investment differs from the actions of the World Bank and IMF in two fundamental ways. IMF and World Bank loans are not seeking a managing interest in investment projects and are offered from intergovernmentally funded pots of money. The World Bank and IMF are special entities under the umbrella of the UN. Each member nation, totalling 190 countries across the globe, has an individual quota that they must pay into IMF funds. Quotas are determined by weighted factors of GDP (50%), openness (30%), economic variability (15%), and international reserves (5%). All countries pay into the funds, which countries can draw loans from for disaster relief (climatic and health) or new development. The IMF distributes these funds through a series of funding programs: Rapid Credit Facility (RCF), Extended Credit Facility (ECF), Standby Credit Facility (SCF), and through explicit support for Low-Income Countries. Curiously, the IMF and World Bank loans, when taken together, covered much of the global south with few countries taking on loans from both entities. Thus, capital flows from wealthier nations paying into the programs as part of UN membership towards developing nations facing particular crises or who are seeking to continue development and bolster economic growth. These funds often focus on stabilizing countries that would otherwise be in perpetual states of unrest. As mentioned above, stability of the state is one of the key factors in predicting the presence of new FDI inflows into developing countries. 

What we’re seeing with various forms of the financialization of primary commodity production is how socio-natural systems and biophysical worlds become packaged into assets that circulate in financial markets and become a source of revenue production in their own right –that is, how they become detached from reality. 18

While seemingly altruistic, these recovery practices are loans through and through, ones that tend to accumulate in regions of the world most vulnerable to the effects of the Climate Crisis. Dripping in irony, these lending practices aim to stabilize markets, one of the only identifiable predictors for FDI, even as market-focused concerns with growth are producing the effects of the Climate Crisis. In 2007, former World Bank Chief Economist Sir Nicholas Stern expressed the view of the World Bank quite succinctly: “Climate change is a result of the greatest market failure the world has seen.” 19 Stern, trading on harm-based models of climate reparations, argues that the management of the markets has been a failure, not that growth-based market openings proliferated by the World Bank and IMF are a failure. 20 Over a decade later, the rhetoric of climate-capitalists is no longer palatable, or amenable to a globally-just future.